Styx Analyse
See how the Styx bike performs on sample rides.
These sample rides introduce the web version of Styx Analyse. It gives a clear, visual view of rides made on the Styx bike: replay the route, see how energy was used and recovered, and analyse the performance.
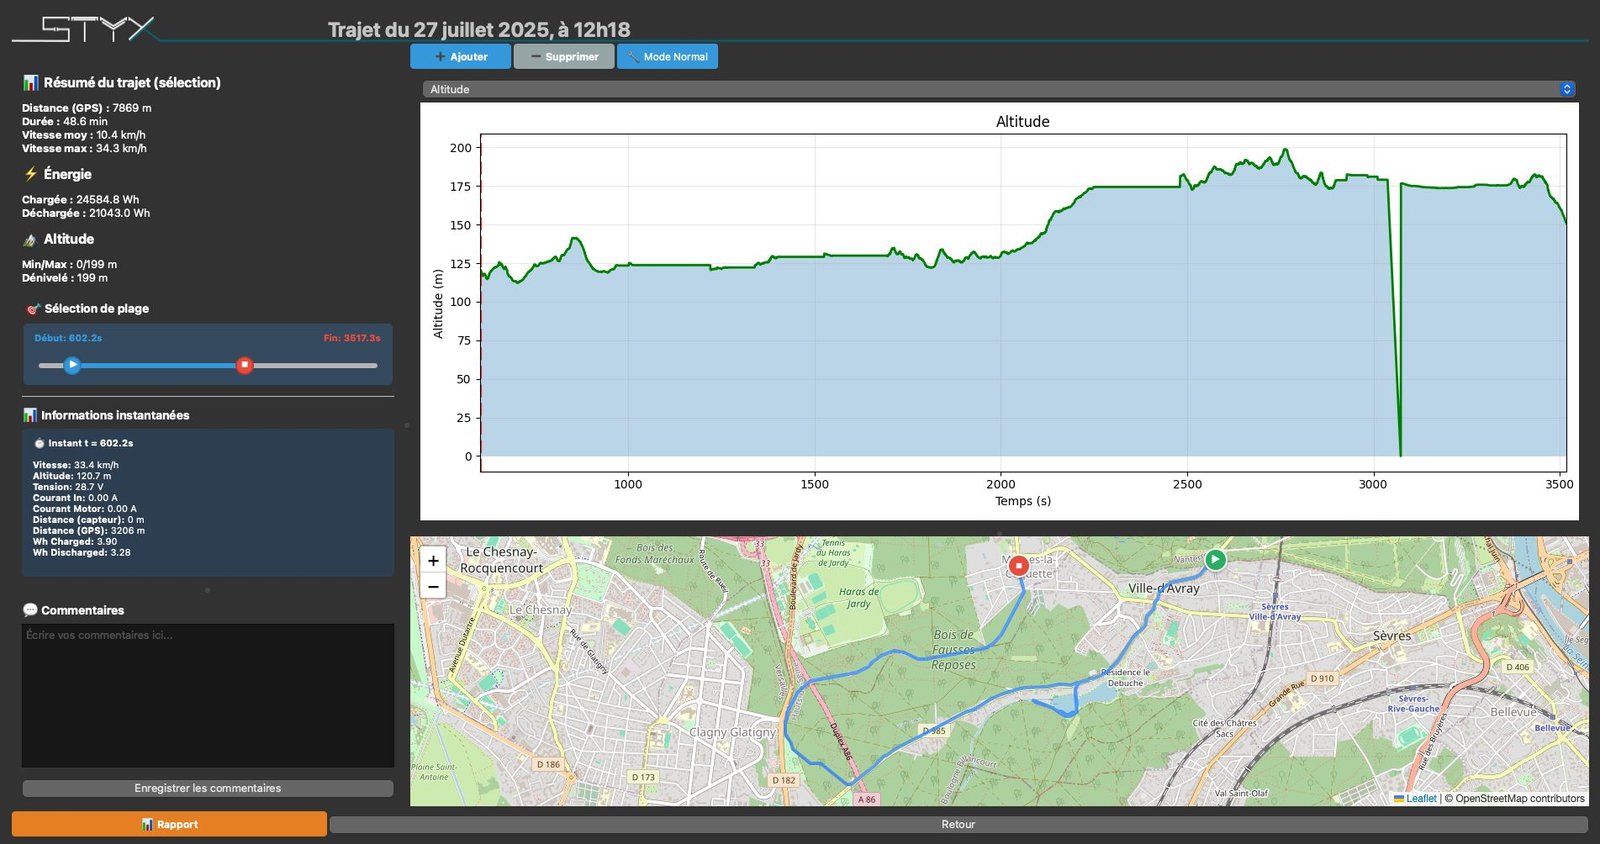
Interactive map: follow the route on a map, with points showing speed, altitude, available energy and the energy balance at every moment.
Custom charts: two interactive charts plot different values (speed, altitude, energy and more) over time; pick what to explore from the menus.
The interface is designed to make the data easy to read and use, to understand each ride better and make the most of the bike.
Once the bikes go into testing, riders will be able to import and analyse their own rides in Styx Analyse.
New rides are added regularly. If you have ideas, suggestions or questions, other kinds of rides can be added on request: get in touch.
The dashboard below is in French.
Styx Analyse for PC and Mac
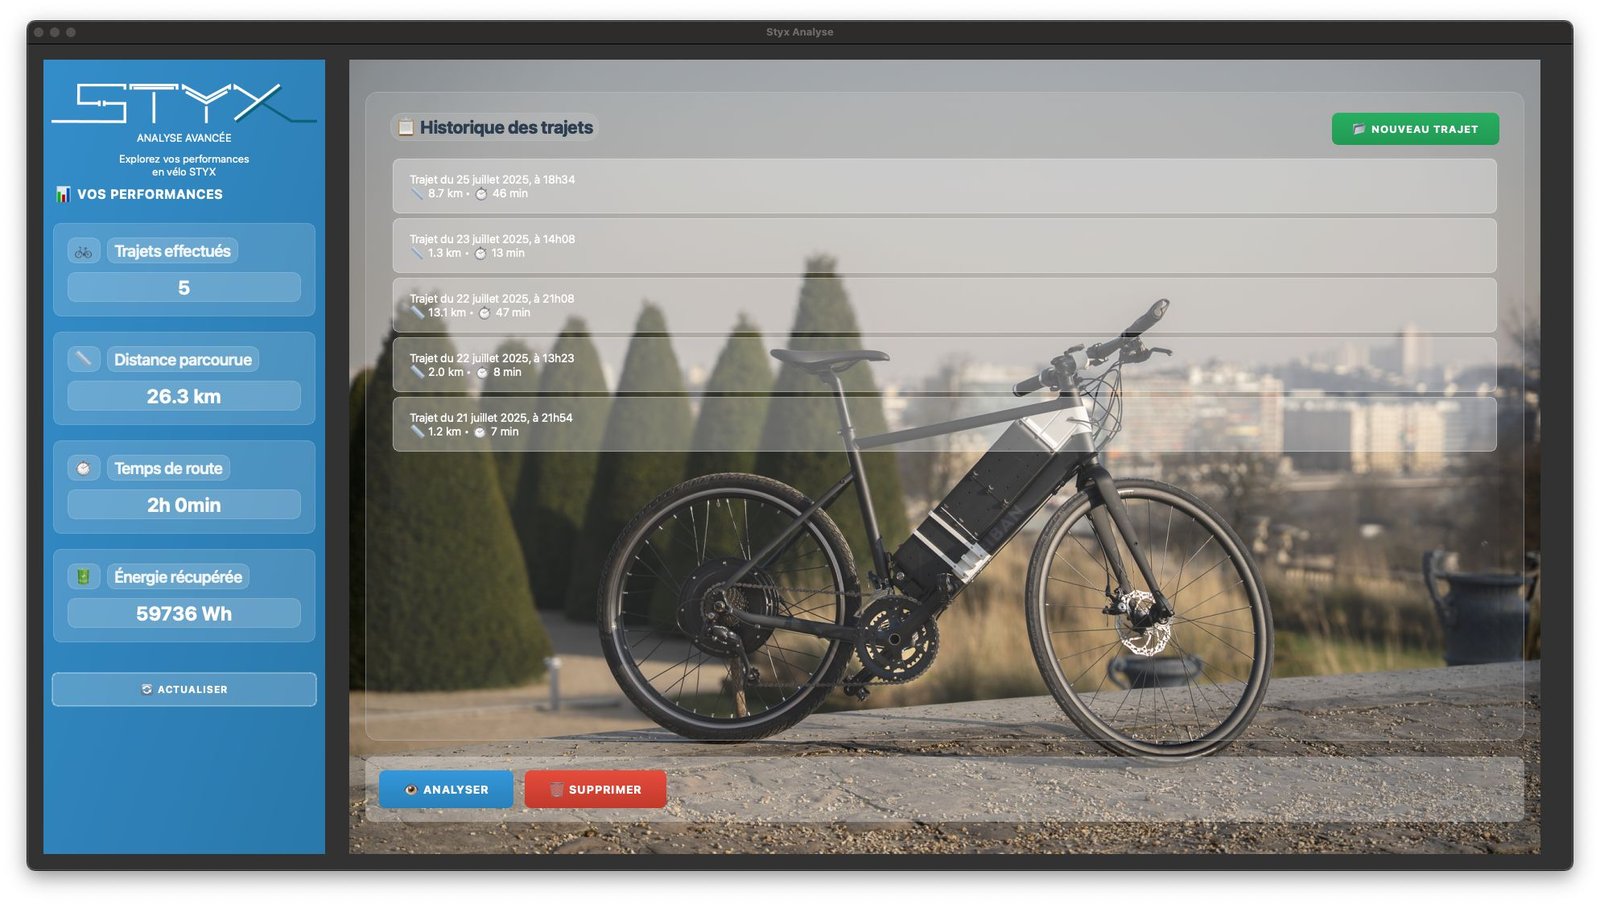
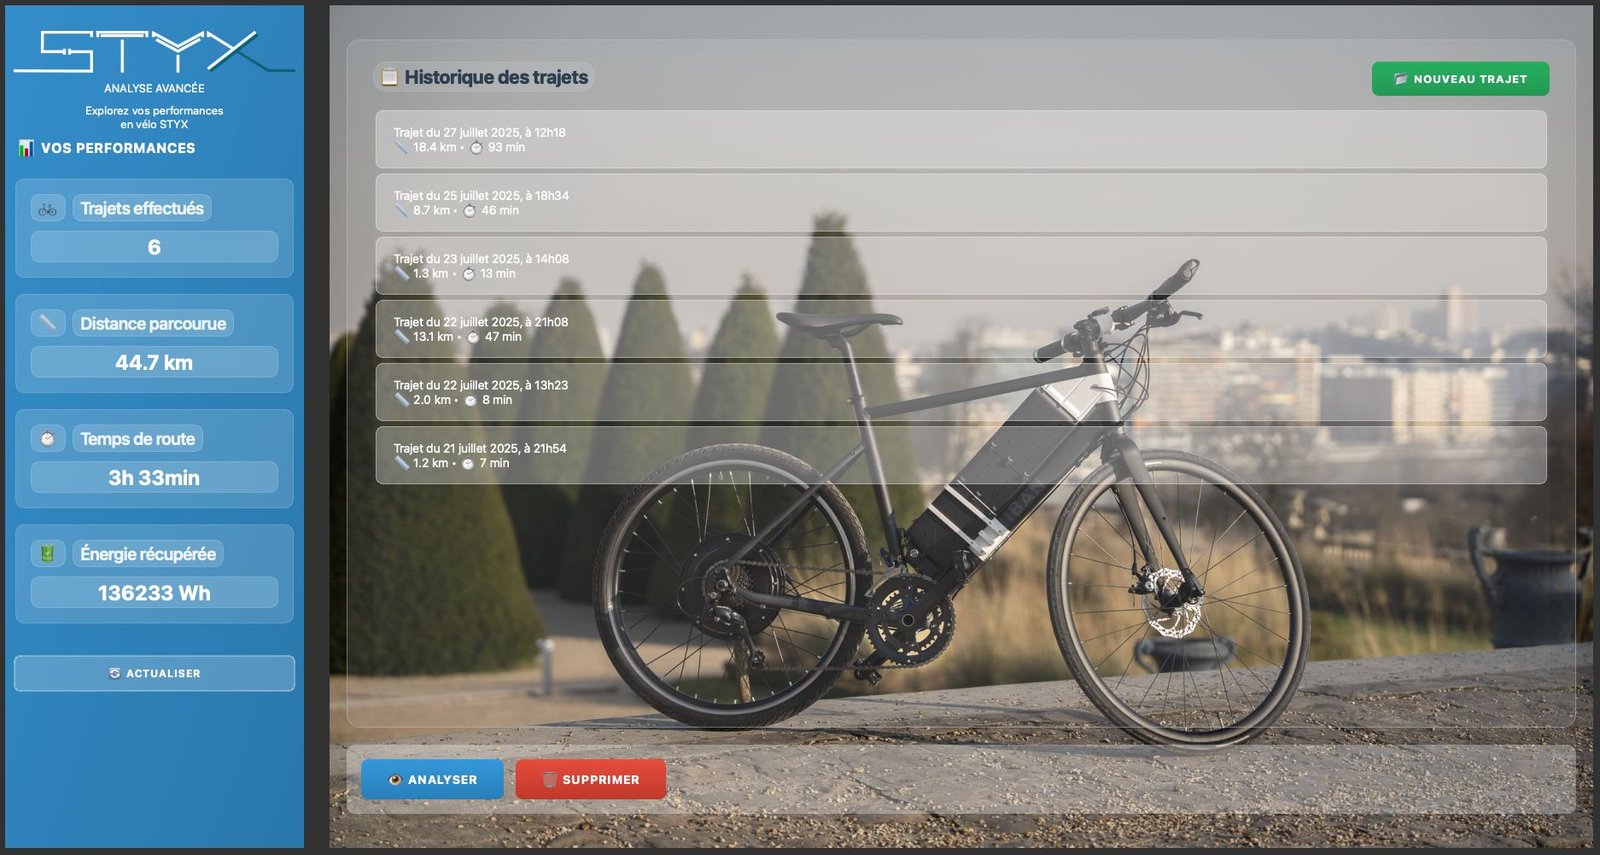
To go further, the Styx Analyse desktop app for PC and Mac reads the rides the bike records on its SD card.
- a history of every ride, with total distance, time and recovered energy;
- for each ride, the map and the curves, with exact values at any moment;
- analysis of a chosen part of a ride, a climb for instance;
- notes on each ride;
- a shareable report, which is where the sample rides on this page come from.
- Rides recorded in summer 2025
- 12
- Distance
- 77.5 km
- Time on the road
- Nearly 7 hours
- Software version
- 0.1, September 2025